
A quick overview
- Natural resource sectors contributed 9–12% of Canada’s GDP between 2019 and 2023, generating over $250 billion annually in direct output.
- Oil & gas remained the largest contributor, peaking at $130.2B in 2022, with Alberta leading production.
- Mining & quarrying grew steadily, reaching $48.9B in 2023, driven by demand for critical minerals like lithium, copper, and nickel.
- Forestry & logging stayed stable, though dipped slightly in 2023 due to reduced construction activity.
- Hydroelectric power delivered consistent GDP contributions (~$30B/year), with Quebec, BC, and Manitoba as primary producers.
- Provincial economies vary widely: Alberta dominates in oil, Quebec in hydro, BC in forestry, and Ontario in mining.
Introduction
Canada’s economic landscape has been forged by the geography it inhabits. Beneath its surface lie commodities that have historically propelled growth, attracted foreign capital, and positioned the nation as a global resource heavyweight. But what do the hard numbers tell us about the real contribution of oil, minerals, forests, and hydroelectric power over the past five years? And how are these assets distributed across provinces?
This article gives a glimpse of Canada’s resource economy, sector by sector, province by province—unveiling the economic weight of each natural resource and their evolution from 2019 to 2023.
Canada’s GDP and the Natural Resource Contribution
Between 2019 and 2023, Canada’s nominal GDP increased from approximately $2.0 trillion to $2.8 trillion, driven by the post-pandemic recovery, inflationary pressures, and a strong global demand for commodities. During this period, natural resource sectors consistently contributed between 9% and 12% to the country’s GDP. Oil and gas extraction alone ranged from 6.4% in 2019 to over 3% by 2023, reflecting volatility in global energy markets. Mining and quarrying (excluding oil and gas) held steady at about 1.7%, while forestry and hydroelectric power accounted for 1.2% and approximately 1.2%, respectively, underscoring the foundational role of renewable energy in Canada’s economic mix.
Together, these sectors generated over CAD 250 billion annually in direct economic output, not including the substantial ripple effects across manufacturing, logistics, and services. The economic footprint of each resource varies widely by province—Alberta dominates in oil and gas, Quebec leads in hydroelectric power, British Columbia in forestry, and Ontario in mining, creating a geographically diverse but deeply interconnected resource economy. These sectors are more than just export engines; they are structural pillars that shape employment, investment, and regional development across Canada.
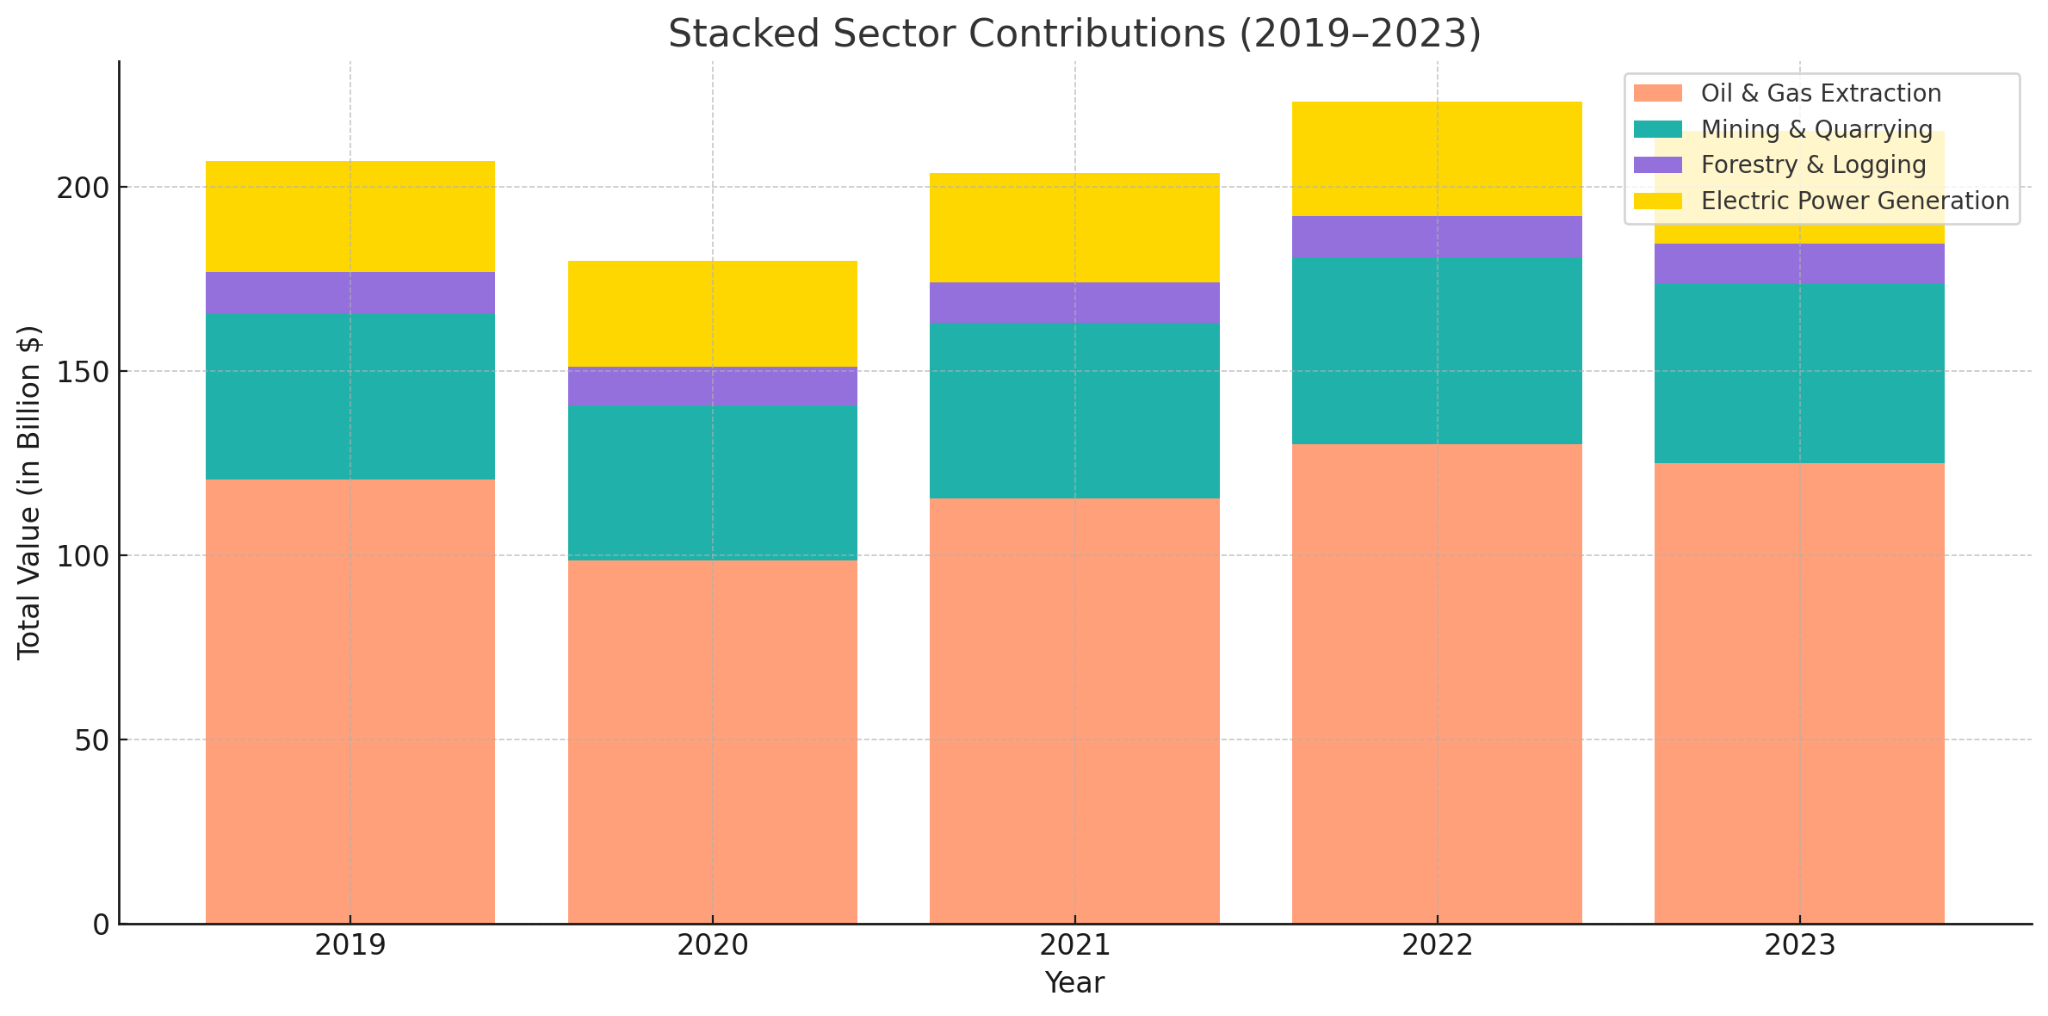
National GDP Trends by Resource Subsector
The graph below tracks the GDP contributions (in billions of CAD) from Canada’s four major natural resource sectors between 2019 and 2023:
Oil & Gas Extraction
Oil and gas has remained Canada’s largest individual contributor within the resource economy, peaking at $130.2 billion in 2022. Although 2023 showed a slight retraction to $125.0 billion, Alberta continues to dominate this sector with extensive operations in the oil sands and conventional extraction.
Mining & Quarrying
A sector increasingly influenced by global electrification, mining has expanded from $45.3 billion in 2019 to $48.9 billion in 2023. Ontario and Quebec have emerged as leaders, particularly in the extraction of gold, nickel, copper, and lithium—key components of the clean energy transition.
Forestry & Logging
Forestry remains critical to regional economies, especially in British Columbia and Quebec. GDP contributions have hovered between $10.5–11.3 billion, with a slight dip in 2023 reflecting reduced construction activity and lumber exports.
Electric Power Generation
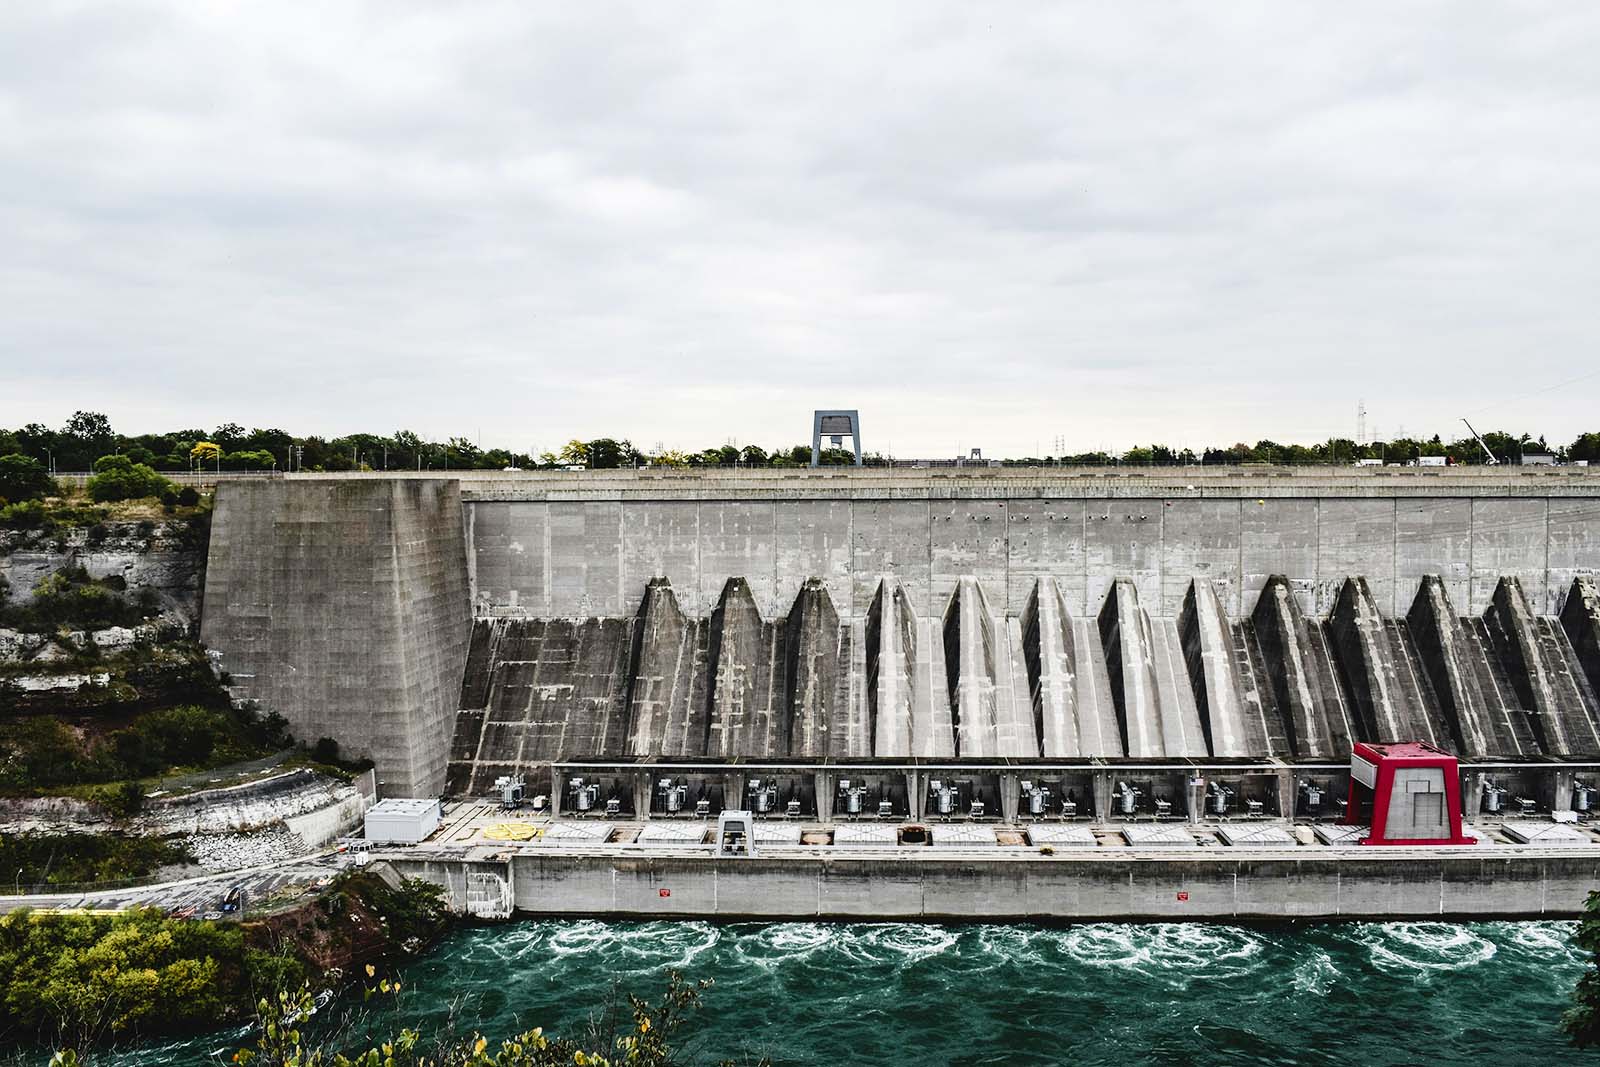
Niagara Falls hydroelectric plant
Hydropower remains a quiet juggernaut. With GDP contributions maintaining around $30 billion annually, Quebec, BC, and Manitoba are responsible for the majority of Canada’s clean electricity output. Modest growth in renewables like solar and wind is evident, particularly in Alberta and Ontario.
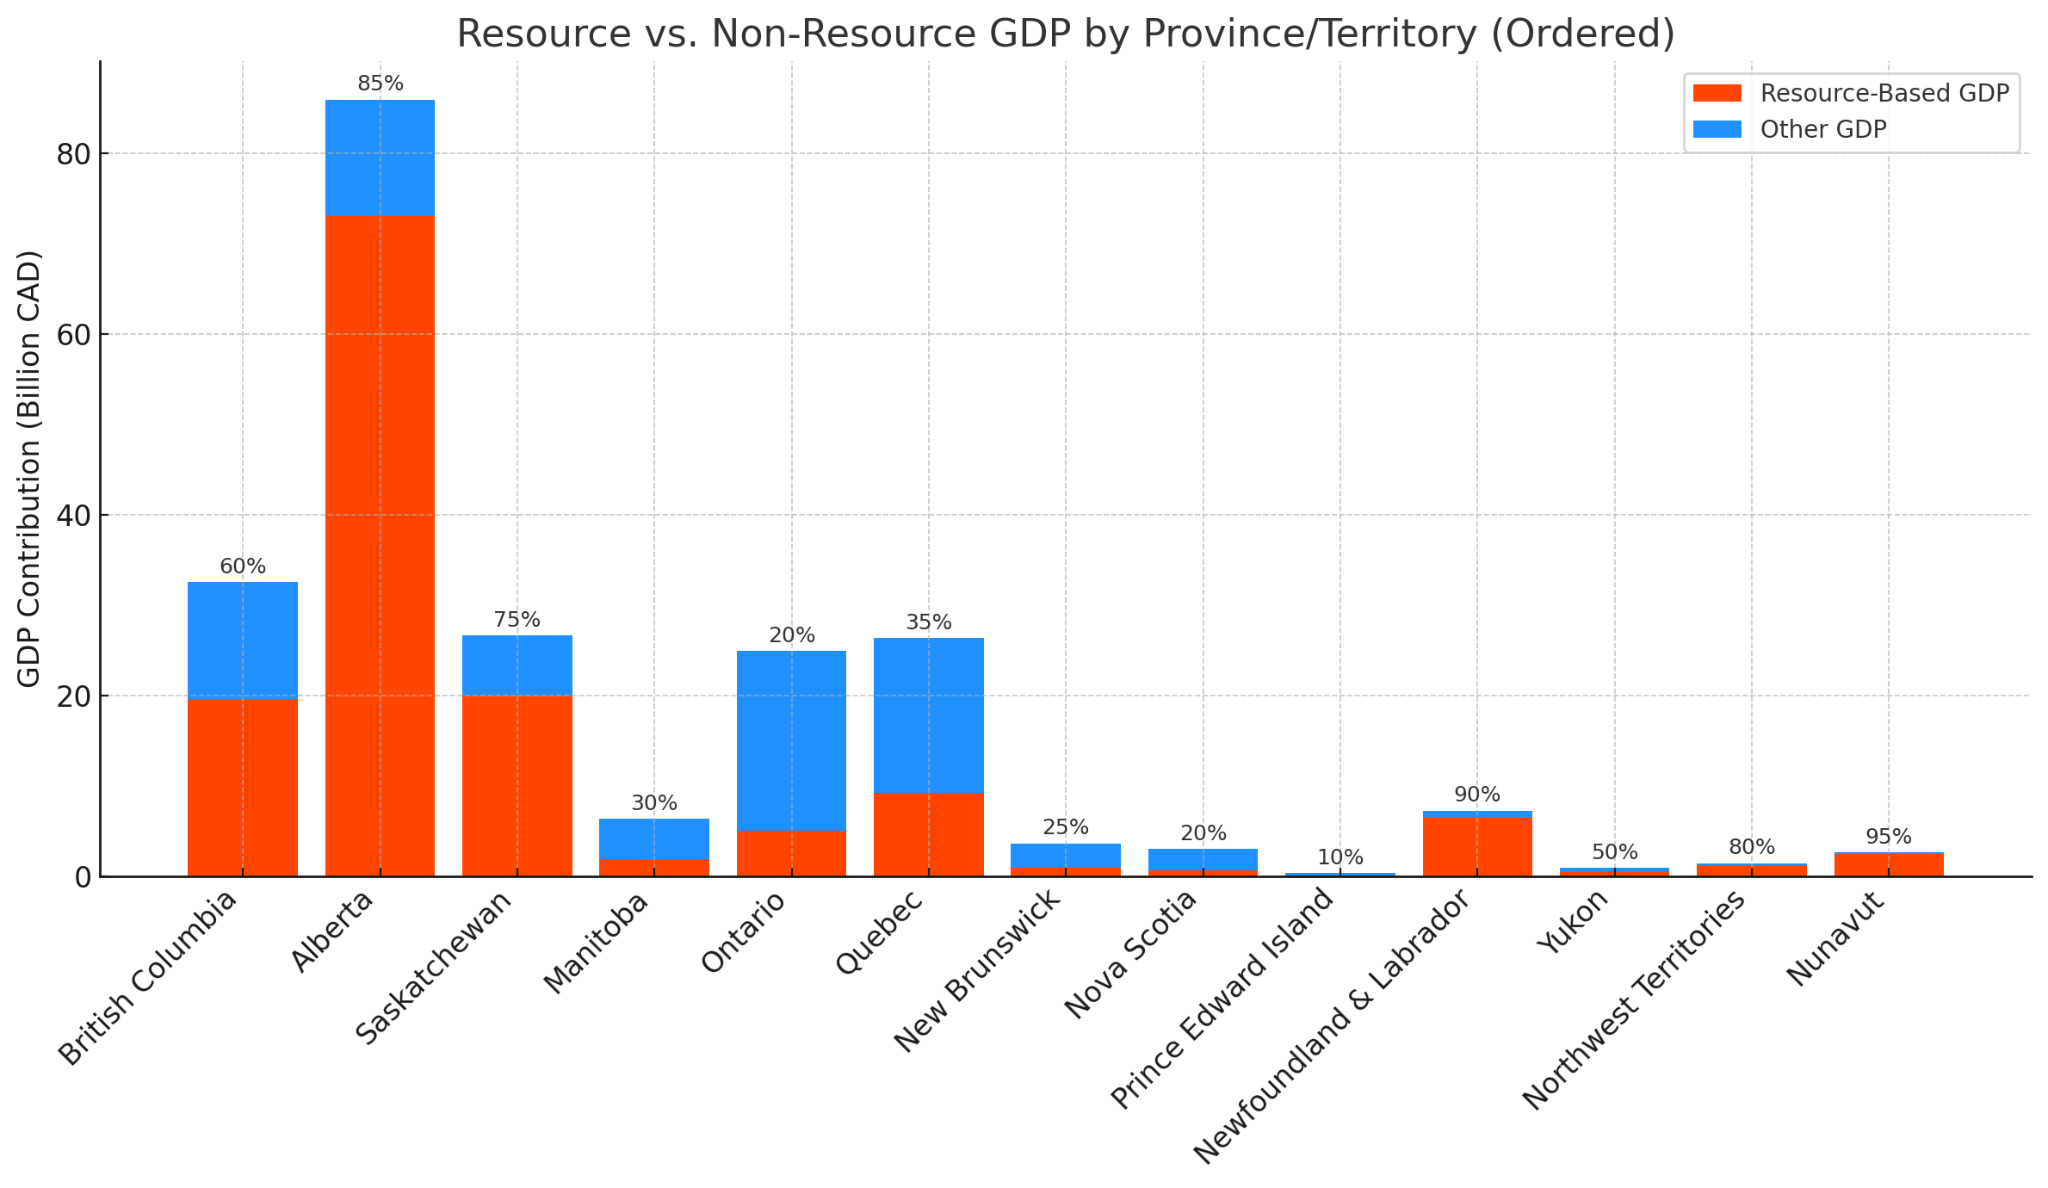
Resource GDP by Region: A Provincial Breakdown
Provincial Contributions to Resource GDP
- Alberta leads the nation with nearly $86B, largely from oil and gas.
- British Columbia’s strength lies in forestry and hydro.
- Saskatchewan’s contributions stem from potash, uranium, and agri-minerals.
- Quebec and Ontario offer a mix of mining and hydroelectric generation.
- Territories and Atlantic Canada, though smaller in volume, rely heavily on resources relative to their GDP sizes.
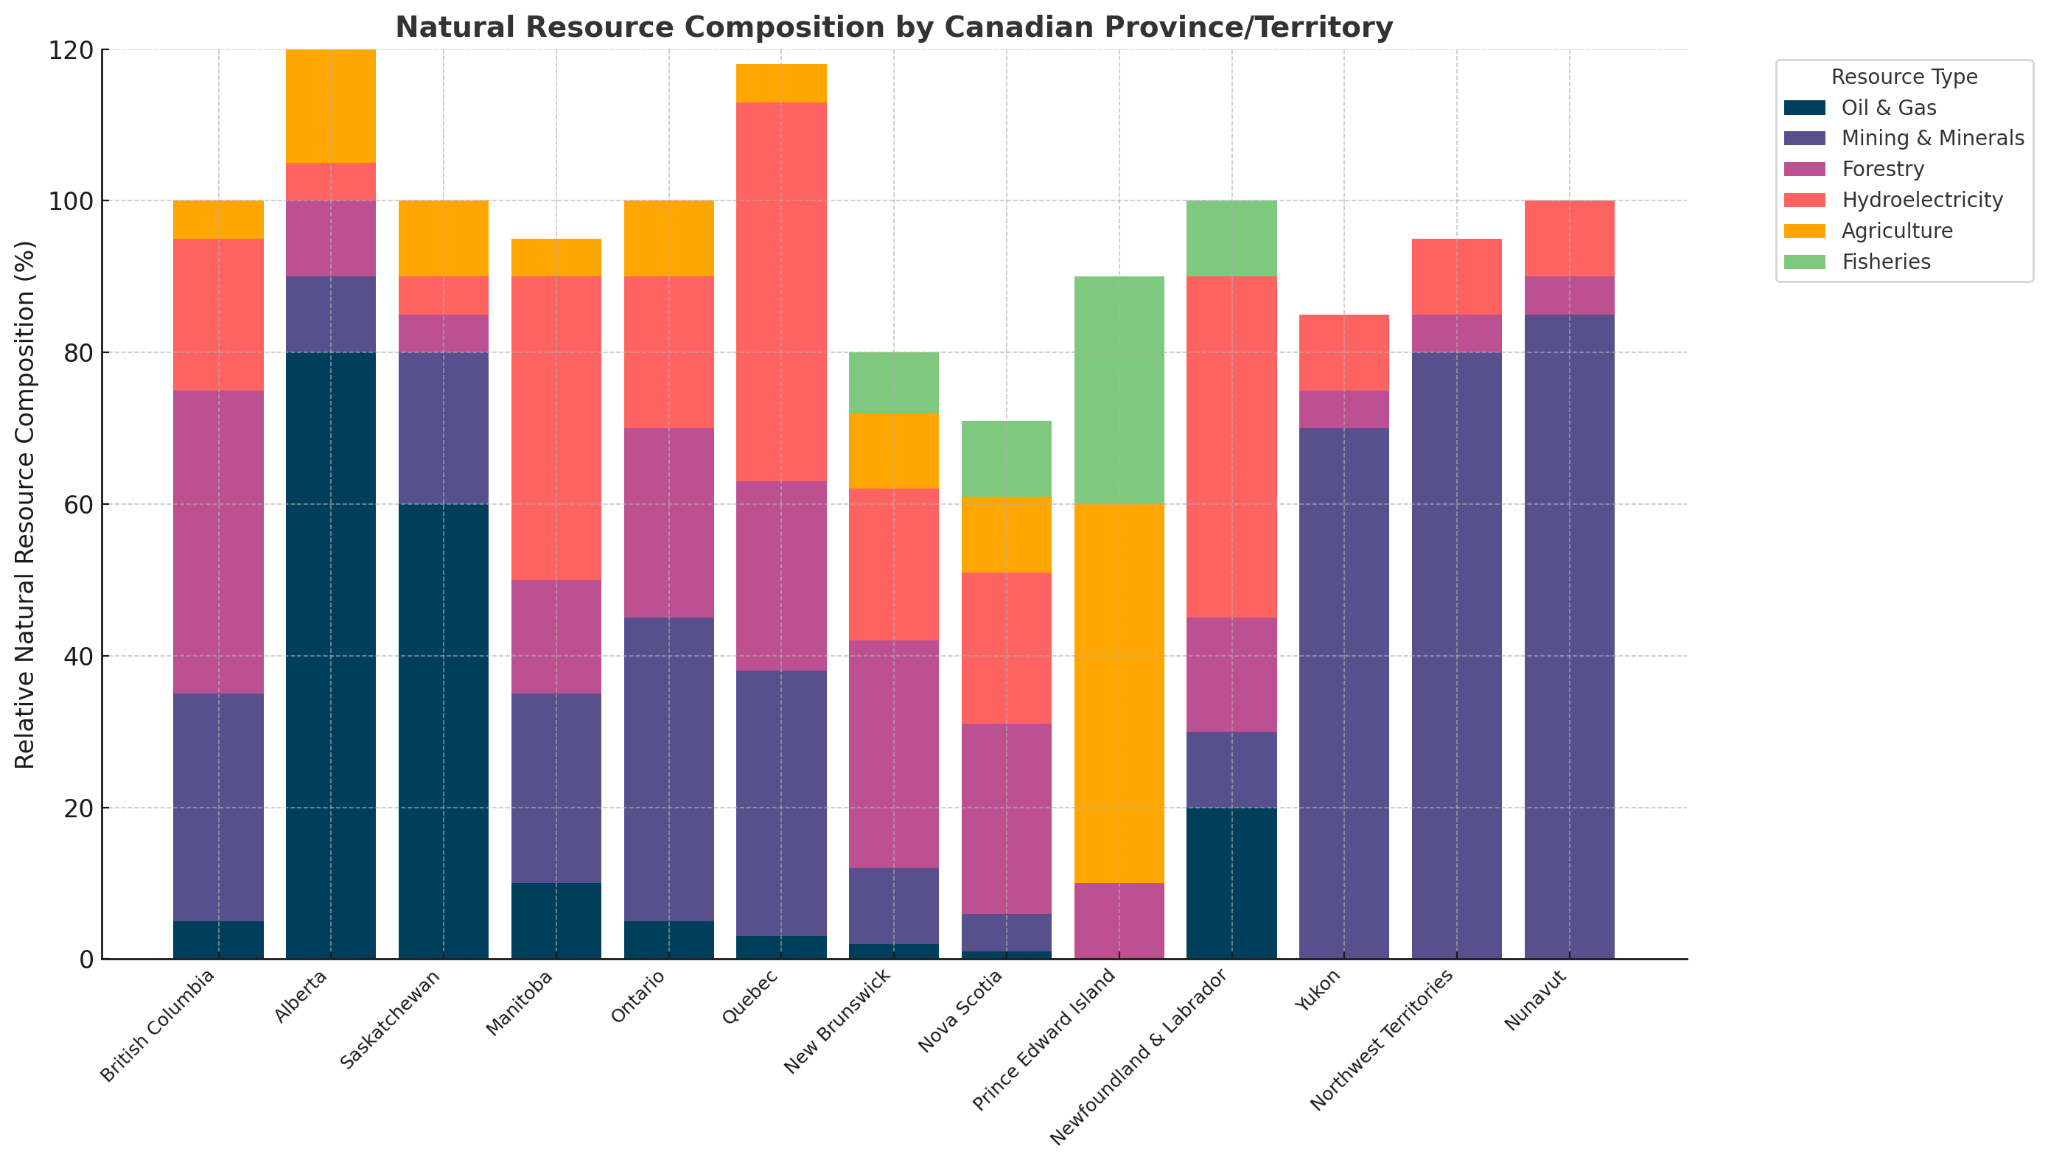
Canada’s Provincial and Territorial Resource Landscape
Canada’s provinces and territories are blessed with a kaleidoscope of natural resources, each shaping the local economy and culture. Together, these regions form a resource-rich tapestry, powering both Canada and the wider world.
Alberta – Oil, Agriculture, and Energy Exports
Alberta stands out as the titan of oil and gas, tapping into vast bitumen reserves in the Athabasca oil sands while supporting agriculture on its prairie plains.
British Columbia – Timber and Mineral Riches
British Columbia is famed for its towering forests and booming forestry industry, alongside rich deposits of copper, coal, and gold, making it a dual force in timber and mining.
Saskatchewan – Potash, Uranium, and Prairie Crops
In addition to oil and gas, Saskatchewan is a powerhouse of uranium and potash production, and a breadbasket for wheat and canola.
Quebec – Hydropower and Critical Minerals
Quebec is a hydroelectric giant, with rivers fueling a vast clean energy network. Its mineral bounty includes iron ore, gold, and emerging lithium deposits vital to green tech.
Ontario – Mining Heritage and Energy Support
Ontario boasts a deep mining history with world-class nickel, gold, and platinum group metals, while also contributing significantly to forestry and electric power generation.
Manitoba – Hydroelectric Excellence and Metal Production
Manitoba quietly excels in hydroelectric generation and is a key player in zinc and nickel mining.
Newfoundland & Labrador – Offshore Oil and Northern Hydro
The province draws energy from offshore oil fields like Hebron and Hibernia, and boasts one of the largest hydro projects in the country—Churchill Falls.
The Maritimes – Forests, Fisheries, and Agricultural Strength
Nova Scotia, New Brunswick, and Prince Edward Island rely on forestry, fisheries, and agriculture. Nova Scotia is also historically known for coal mining.
The Territories – Canada’s Northern Mineral Frontier
Nunavut and the Northwest Territories are rich in gold, diamonds, and iron. Yukon continues its gold rush legacy with modern mining developments.
Conclusion
Over the past five years, Canada’s natural resource sectors—including oil and gas extraction, mining and quarrying, forestry and logging, and electric power generation—have contributed an estimated $205.8 billion CAD annually to the national economy. Based on an average national GDP of approximately $2.2 trillion CAD (Statistics Canada, Table 36-10-0104-01), this represents around 9.4% of total economic output.
This sustained contribution highlights the steady role that natural resources continue to play in Canada’s broader economic structure. While the share of GDP from resource industries varies significantly across provinces and territories—with some regions more heavily reliant than others—the sector remains a substantial pillar of national economic performance.
These figures provide a foundation for ongoing analysis and discussion around regional economic strategy, industrial diversification, and long-term planning—particularly as Canada navigates shifts in global demand, climate priorities, and innovation opportunities.
Source List & Reference Highlights
- Statistics Canada. Natural Resources Indicators, Q4 2023
- Statistics Canada. GDP by Industry Overview, 2023
- Statistics Canada. Natural Resources Provincial Accounts, 2023
- Natural Resources Canada. 10 Key Facts on Canada’s Natural Resources
- Statistics Canada. Natural Resources Indicators, Q4 2023
- Statistics Canada. GDP by Industry Overview, 2023
- Statistics Canada. Natural Resources Provincial Accounts, 2023
- Natural Resources Canada. 10 Key Facts on Canada’s Natural Resources
- Statistics Canada. Natural Resources Provincial Accounts, 2023
#CanadaResources #EconomicData #SRandED #InnovationInIndustry #NaturalResourceEconomy #CleanEnergyCanada #ResourceStrategy #CheckpointResearch #ProvincialEconomy #IndustrialCanada #MiningToHydro
The data tells a clear story: Canada’s resource industries remain critical drivers of economic output, investment, and regional development.
At Checkpoint Research, we work with companies across these sectors—whether you’re optimizing mining operations in Ontario, modernizing hydro infrastructure in Quebec, or improving forestry logistics in B.C. What often looks like operational problem-solving on the surface is, in fact, innovation that qualifies for SR&ED.
If your team is tackling challenges in energy, extraction, or resource efficiency, you could be missing out on federal support designed to reward that progress.
Let’s turn your technical advancements into strategic funding—so you can keep building what drives Canada forward.
8,500
Number of Projects
500M
Total Claim Expenditures
96.5%
Successful Claims